May we use Google Analytics cookies to measure visits across macvi.org, plus Industry filters and company-link clicks? Google receives usage and device data only if you accept. No advertising features. Your choice is optional and can be changed below. Privacy details
Challenges / Vision-to-Chart Data Association
| Validation | Test | |||||||||
|---|---|---|---|---|---|---|---|---|---|---|
| User | P | R | F1 | mIoU | Overall | P | R | F1 | mIoU | Overall |
| 1750 | 0.9941 | 0.8024 | 0.8880 | 0.8823 | 0.8851 | 0.9248 | 0.6934 | 0.7926 | 0.7365 | 0.7646 |
| 431 | 0.8627 | 0.7761 | 0.8171 | 0.6753 | 0.7462 | 0.8563 | 0.7604 | 0.8055 | 0.6718 | 0.7386 |
| 1818 | 0.4093 | 0.3849 | 0.3967 | 0.3629 | 0.3798 | 0.4107 | 0.3827 | 0.3962 | 0.3705 | 0.3834 |
| 649 | 0.1835 | 0.1809 | 0.1822 | 0.2357 | 0.2090 | 0.2170 | 0.2107 | 0.2138 | 0.2499 | 0.2318 |
Quick links: Dataset download Submit Leaderboard Ask for help
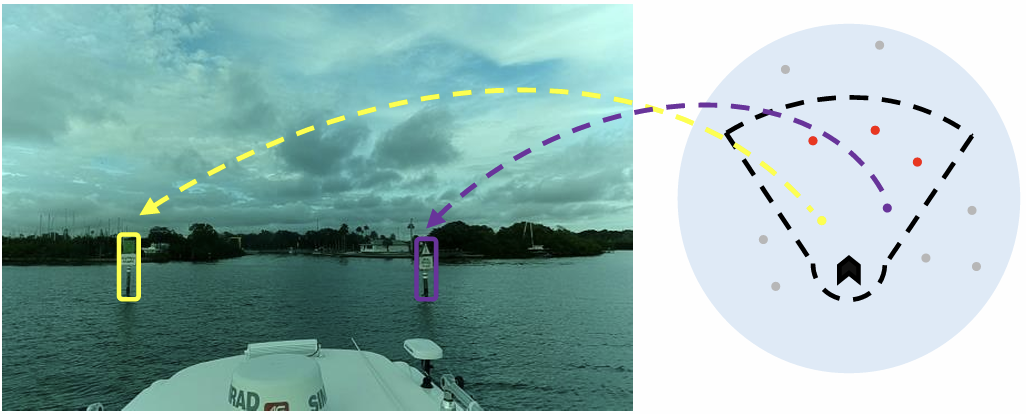
This challenge is about augmenting navigation data for maritime vehicles (boats). Given an image captured by boat-mounted camera, and chart markers of nearby navigational aids (buoys), the task is to identify visible buoys and match them with their corresponding chart markers. The goal is to maximize detected buoys as well as correct matches while minimizing localization error of detected buoys and wrong detections. The challenge is based on the paper "Real-Time Fusion of Visual and Chart Data for Enhanced Maritime Vision".
The task is to develop a deep learning model capable of detecting buoys in a monocular image, and matching them to associated chart positions. Models will be evaluated on both detection and matching accuracy as well as localization error.
The dataset consists of 5189 entries, with each entry containing a single RGB-based image,
a variable amount of queries, and a variable amount of labels. Each query denotes chart data of a nearby buoy,
and has the format: (query id, distance to ship [meters], bearing from ship centerline [degrees], longitude, latidude).
Each label denotes a nearby buoy visible in the image, and has the format (query id, BB center x, BB center y, BB width, BB height),
where BB location specification follows the YOLO format and denotes the corresponding queries position in the image.
Note that this dataset contains entries where no buoy is visible.
The dataset is provided in a predefined format split into training and validation sets for use with the baseline training code.
Participants are free to further manipulate or reorganize the data according to their own experimental needs.
The leaderboard evaluation will be conducted on a separate, unseen dataset that is not shared with the participants. In addition, to enable participants to experiment with their own methods,
raw IMU data corresponding to each sequence is also provided. The IMU data is not integrated into the baseline training code;
however, participants may extract and incorporate these raw measurements into their own algorithms during training if desired.
The submitted models are evaluated on a test set that is not publicly available.
The following metrics are employed to assess model capabilities:
To participate in the challenge follow these steps:
To help you get started and provide a brief introduction to the topic, we have developed a fusion transformer based on DETR. You can find the code here and the 120-epoch pre-trained checkpoint here.
If you have any questions, please join the MaCVi Support forum.